Challenge
This shop looked healthy on paper. The trucks were booked, revenue was up, and the company P&L closed somewhere around 6 percent net most months, right at the residential HVAC median. The problem was that nobody knew which jobs made that money and which ones lost it until the books closed weeks later. Margin was a month-end surprise, not a daily number.
Three leaks ran underneath the surface. First, job costing happened after the fact. ServiceTitan held the field data and QuickBooks held the financial truth, but the two were reconciled by hand long after the crew left the site, so a job that ran over on labor or pulled extra parts only showed up as a thinner number on a report nobody read in time to act. Second, the flat-rate pricebook was stale. Material costs had climbed 12 to 18 percent since 2023 and parts were rising 5 to 10 percent a year, but the book had not kept pace, so a slice of the work was being sold below its real cost without anyone deciding to do that. Third, truck stock leaked. A tech grabbed a capacitor for one job and nobody recorded it, so the cost floated into general shrinkage instead of landing against the job that consumed it.
Approach
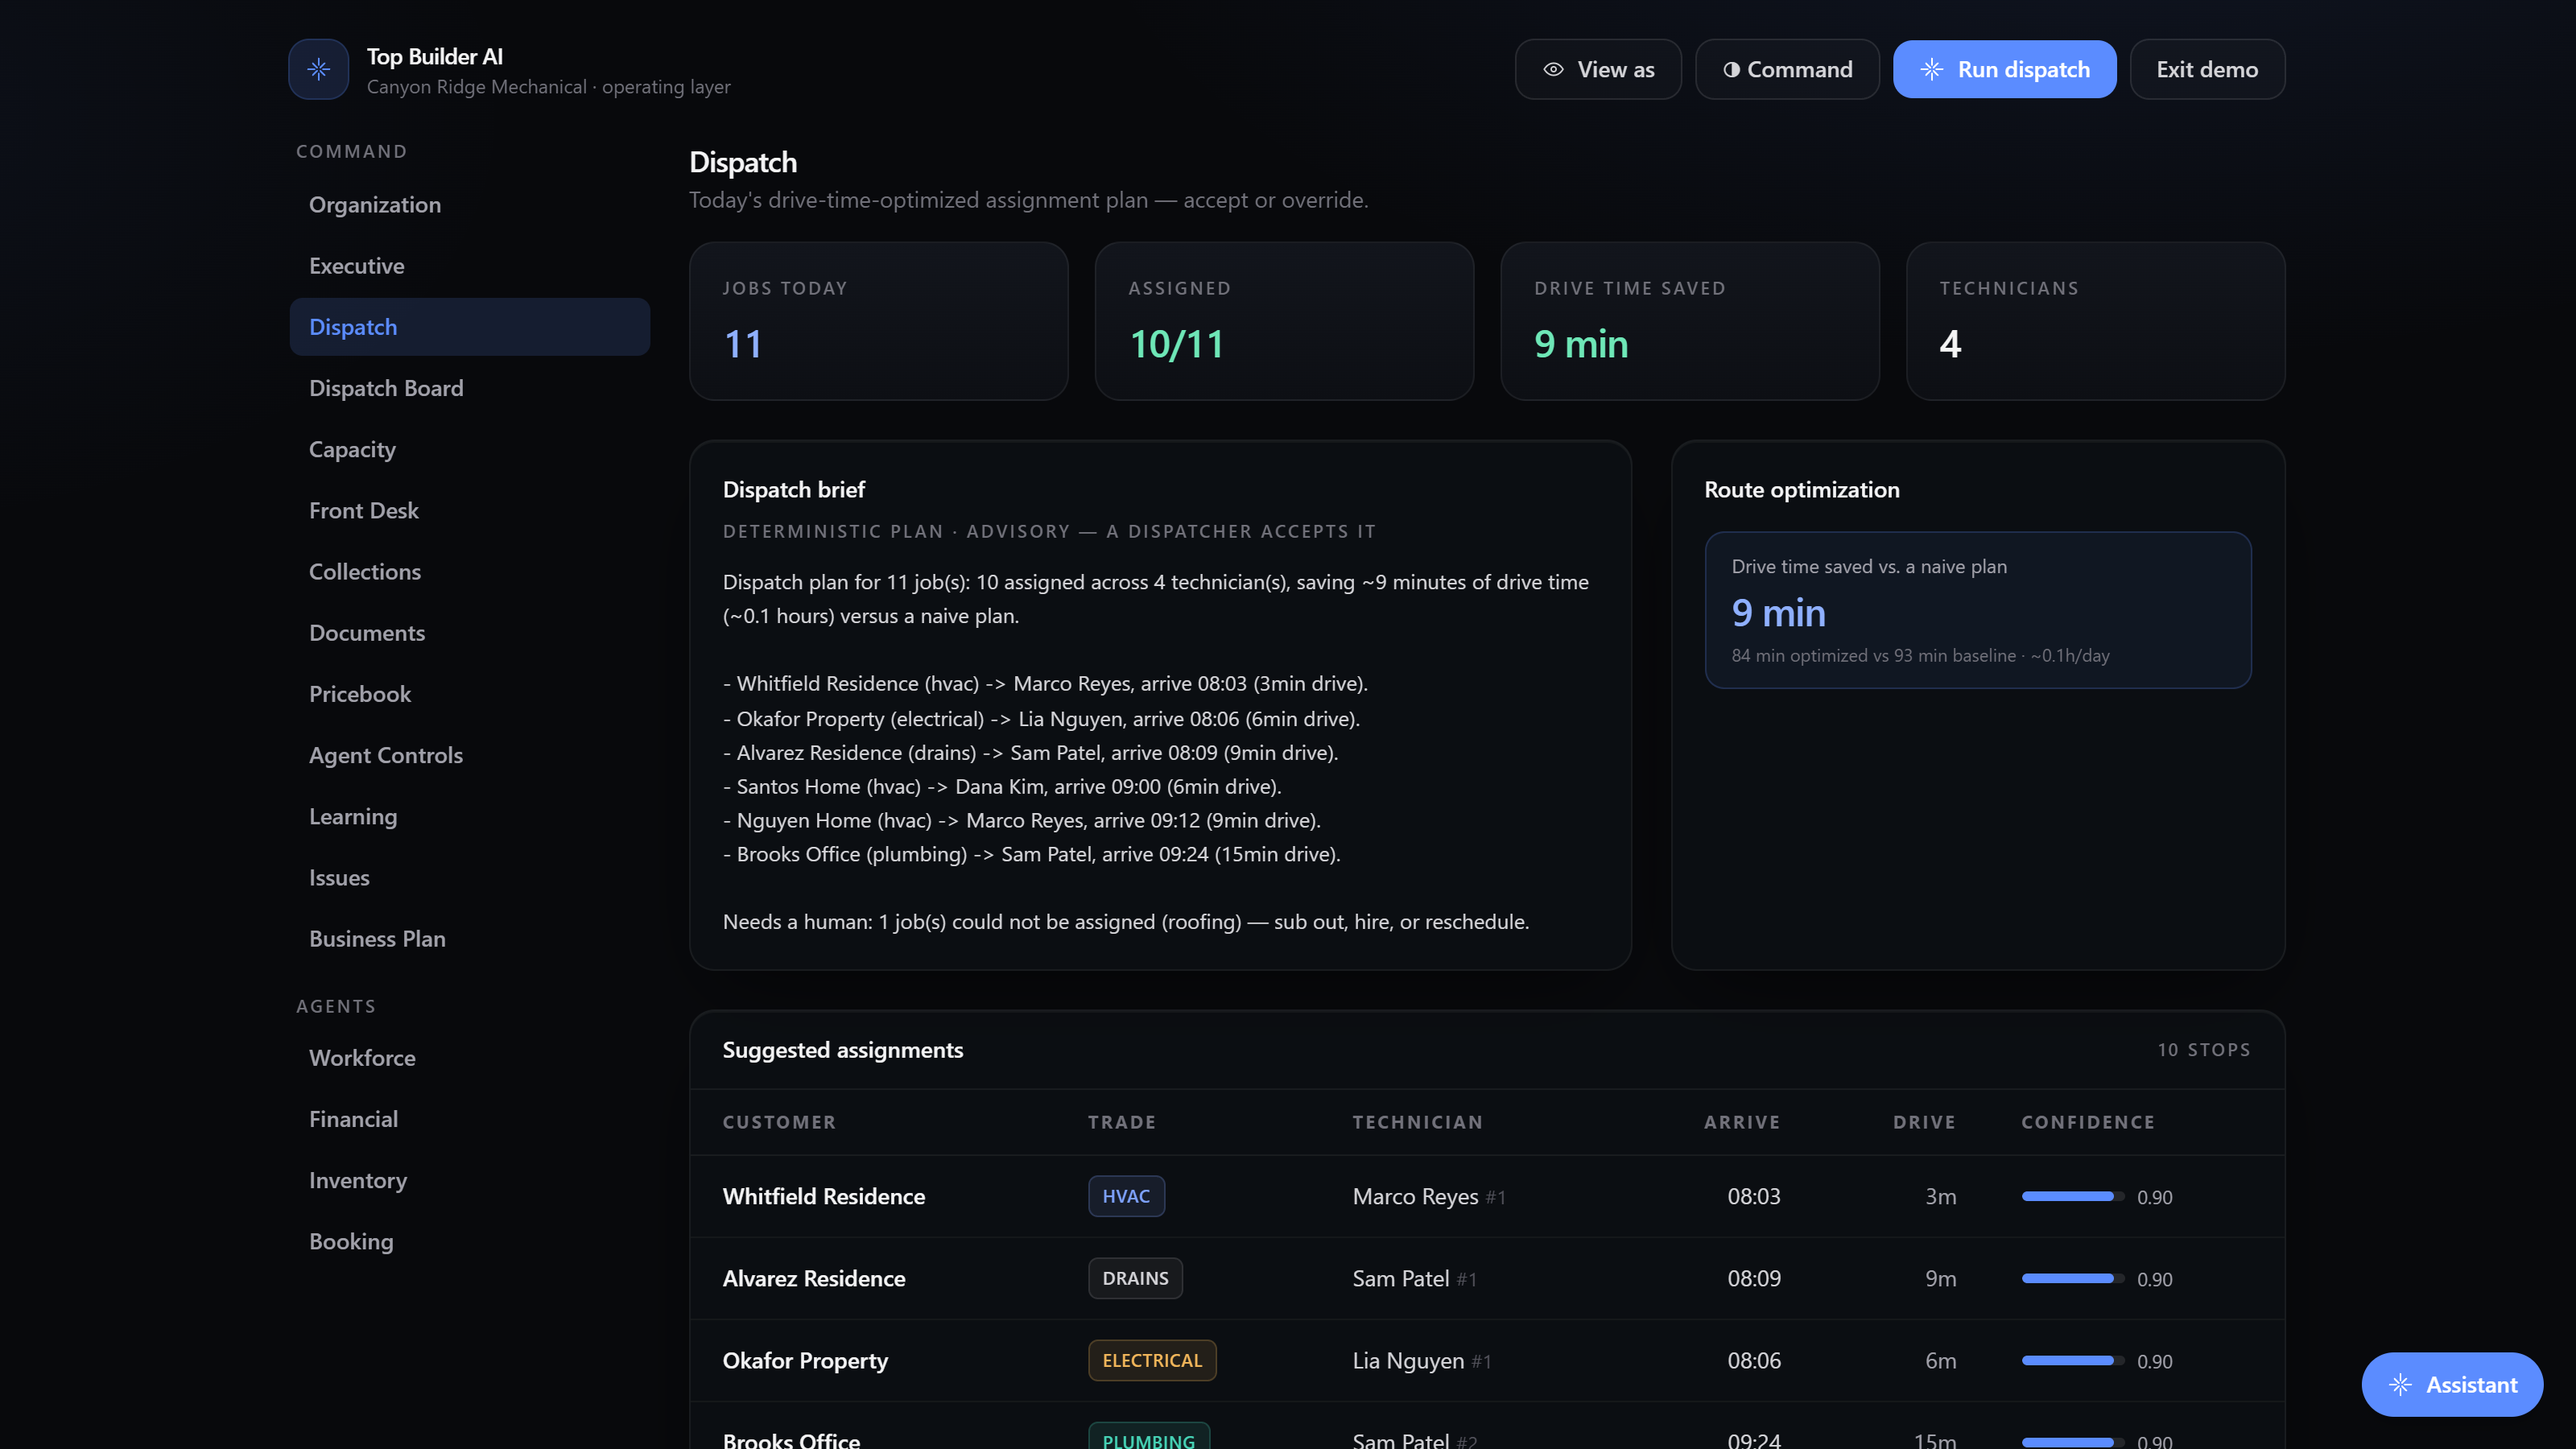
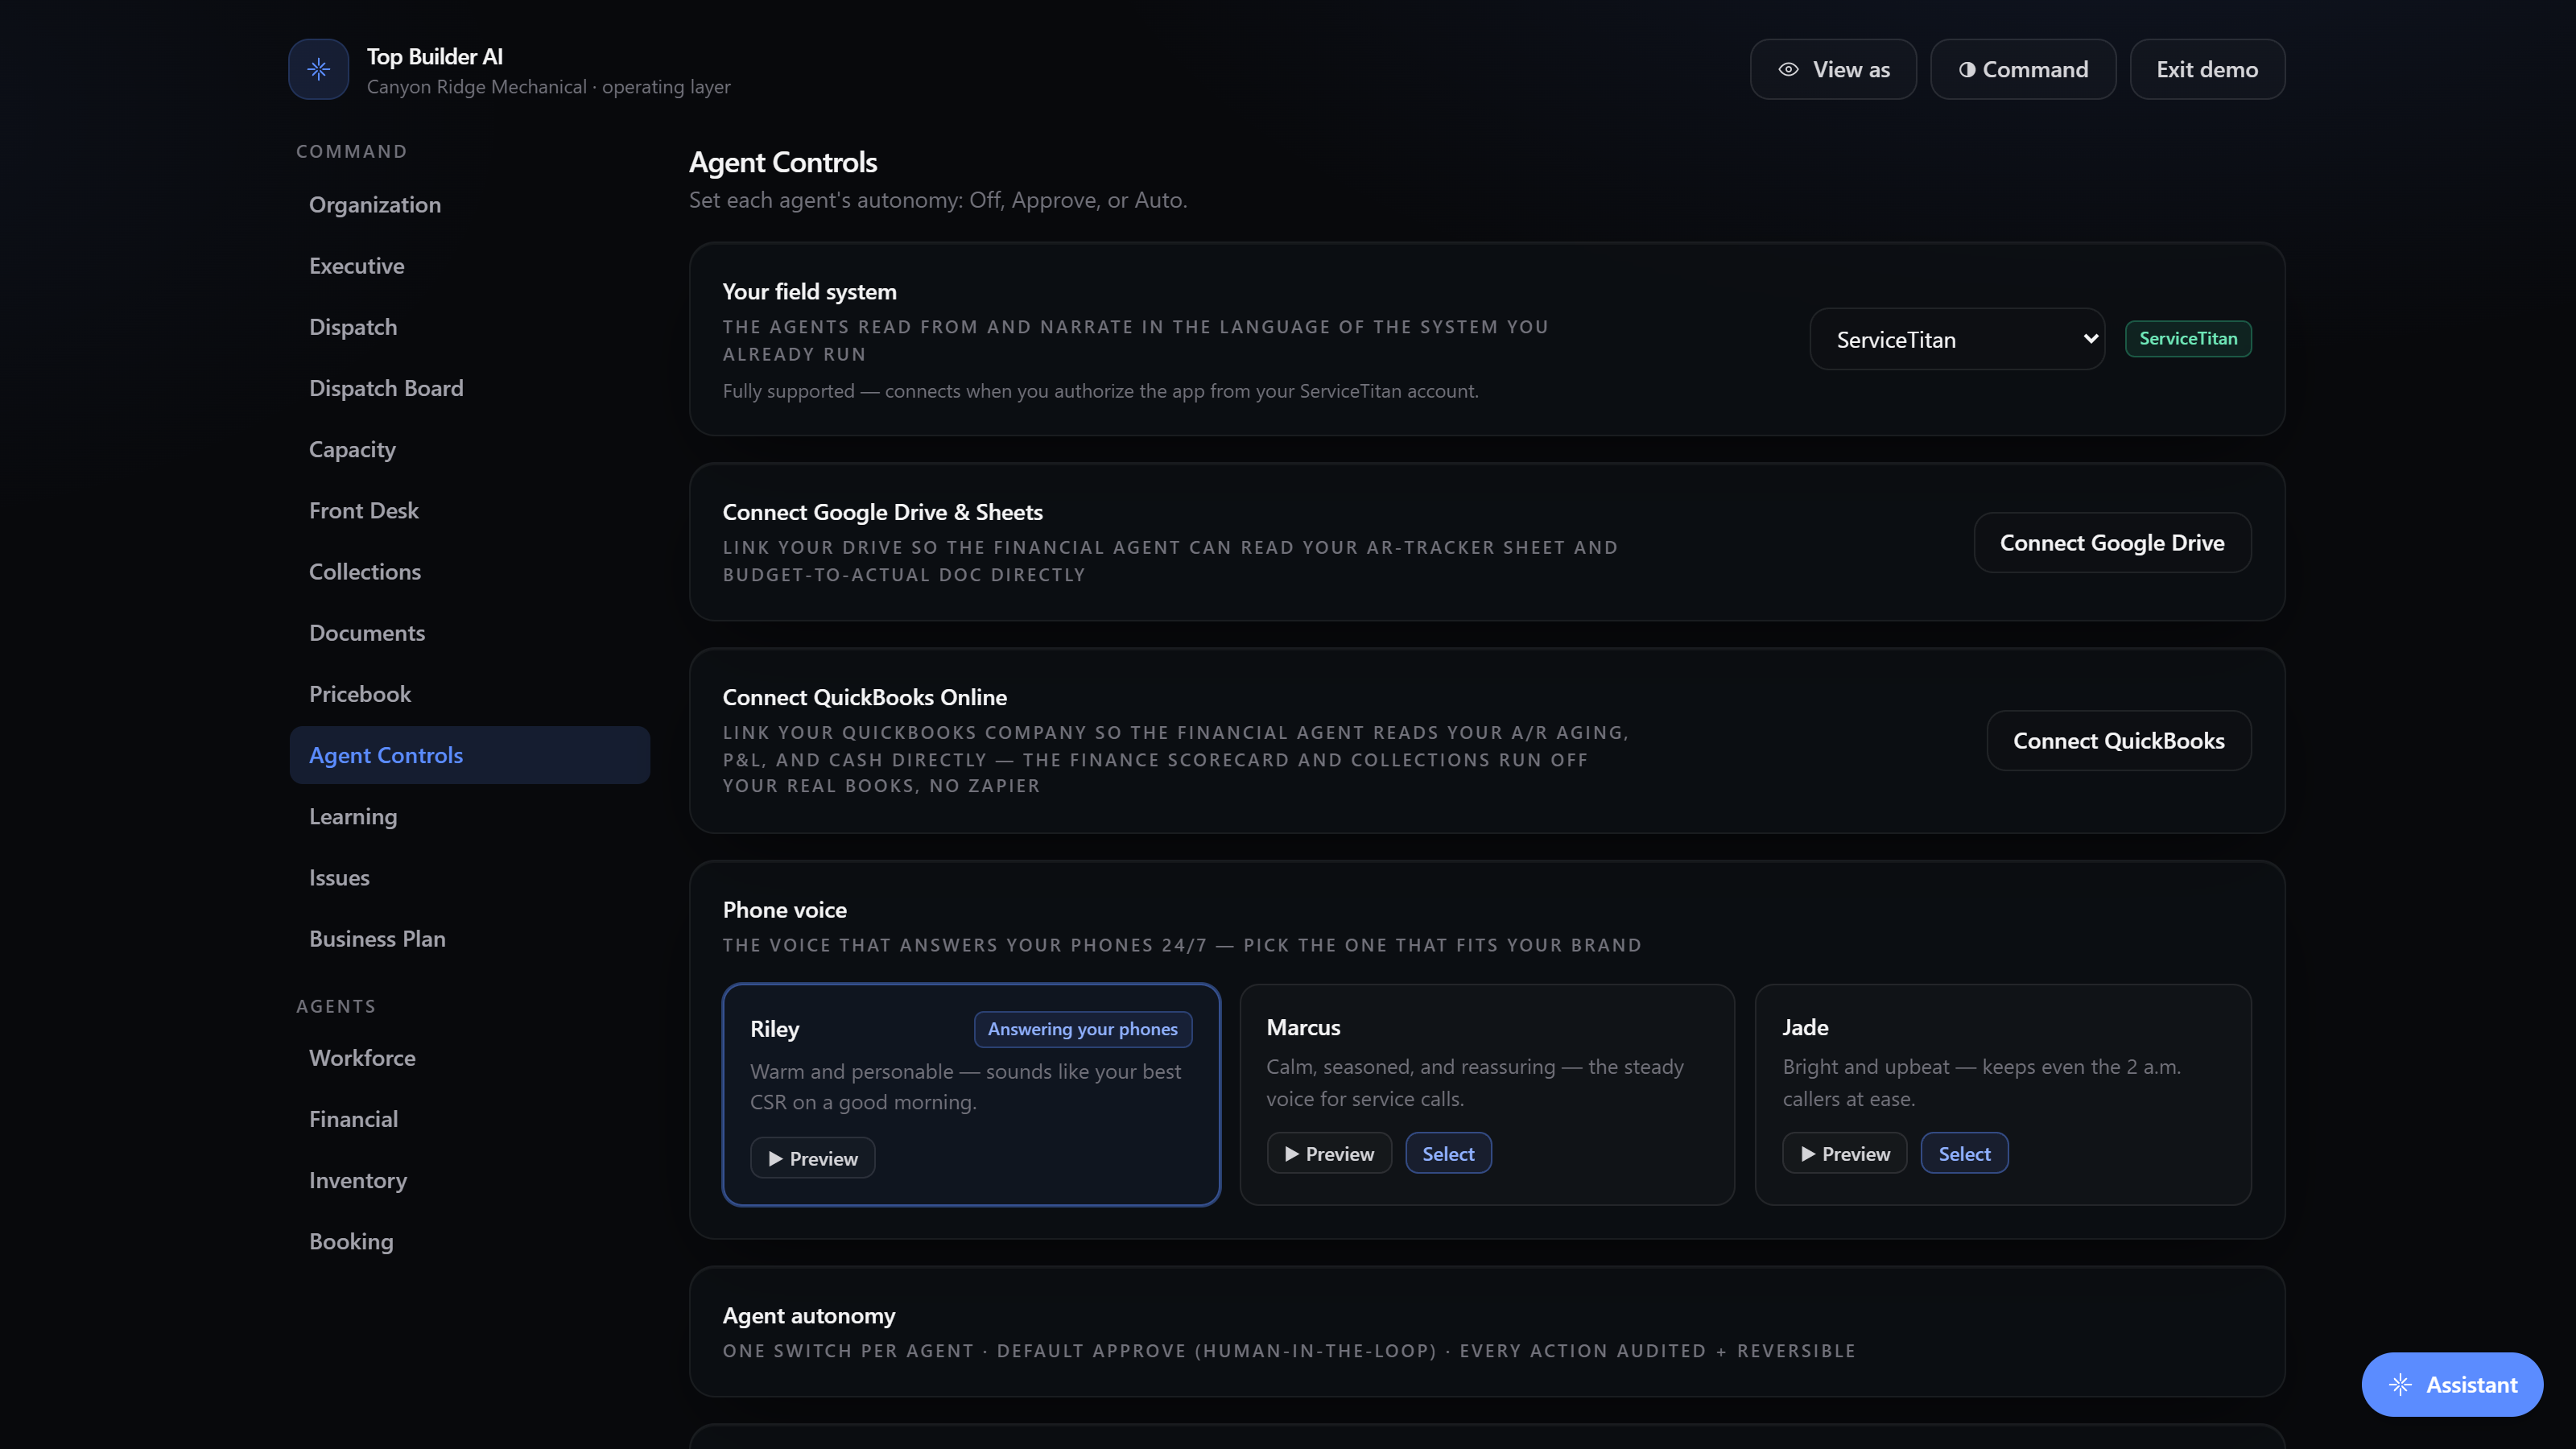
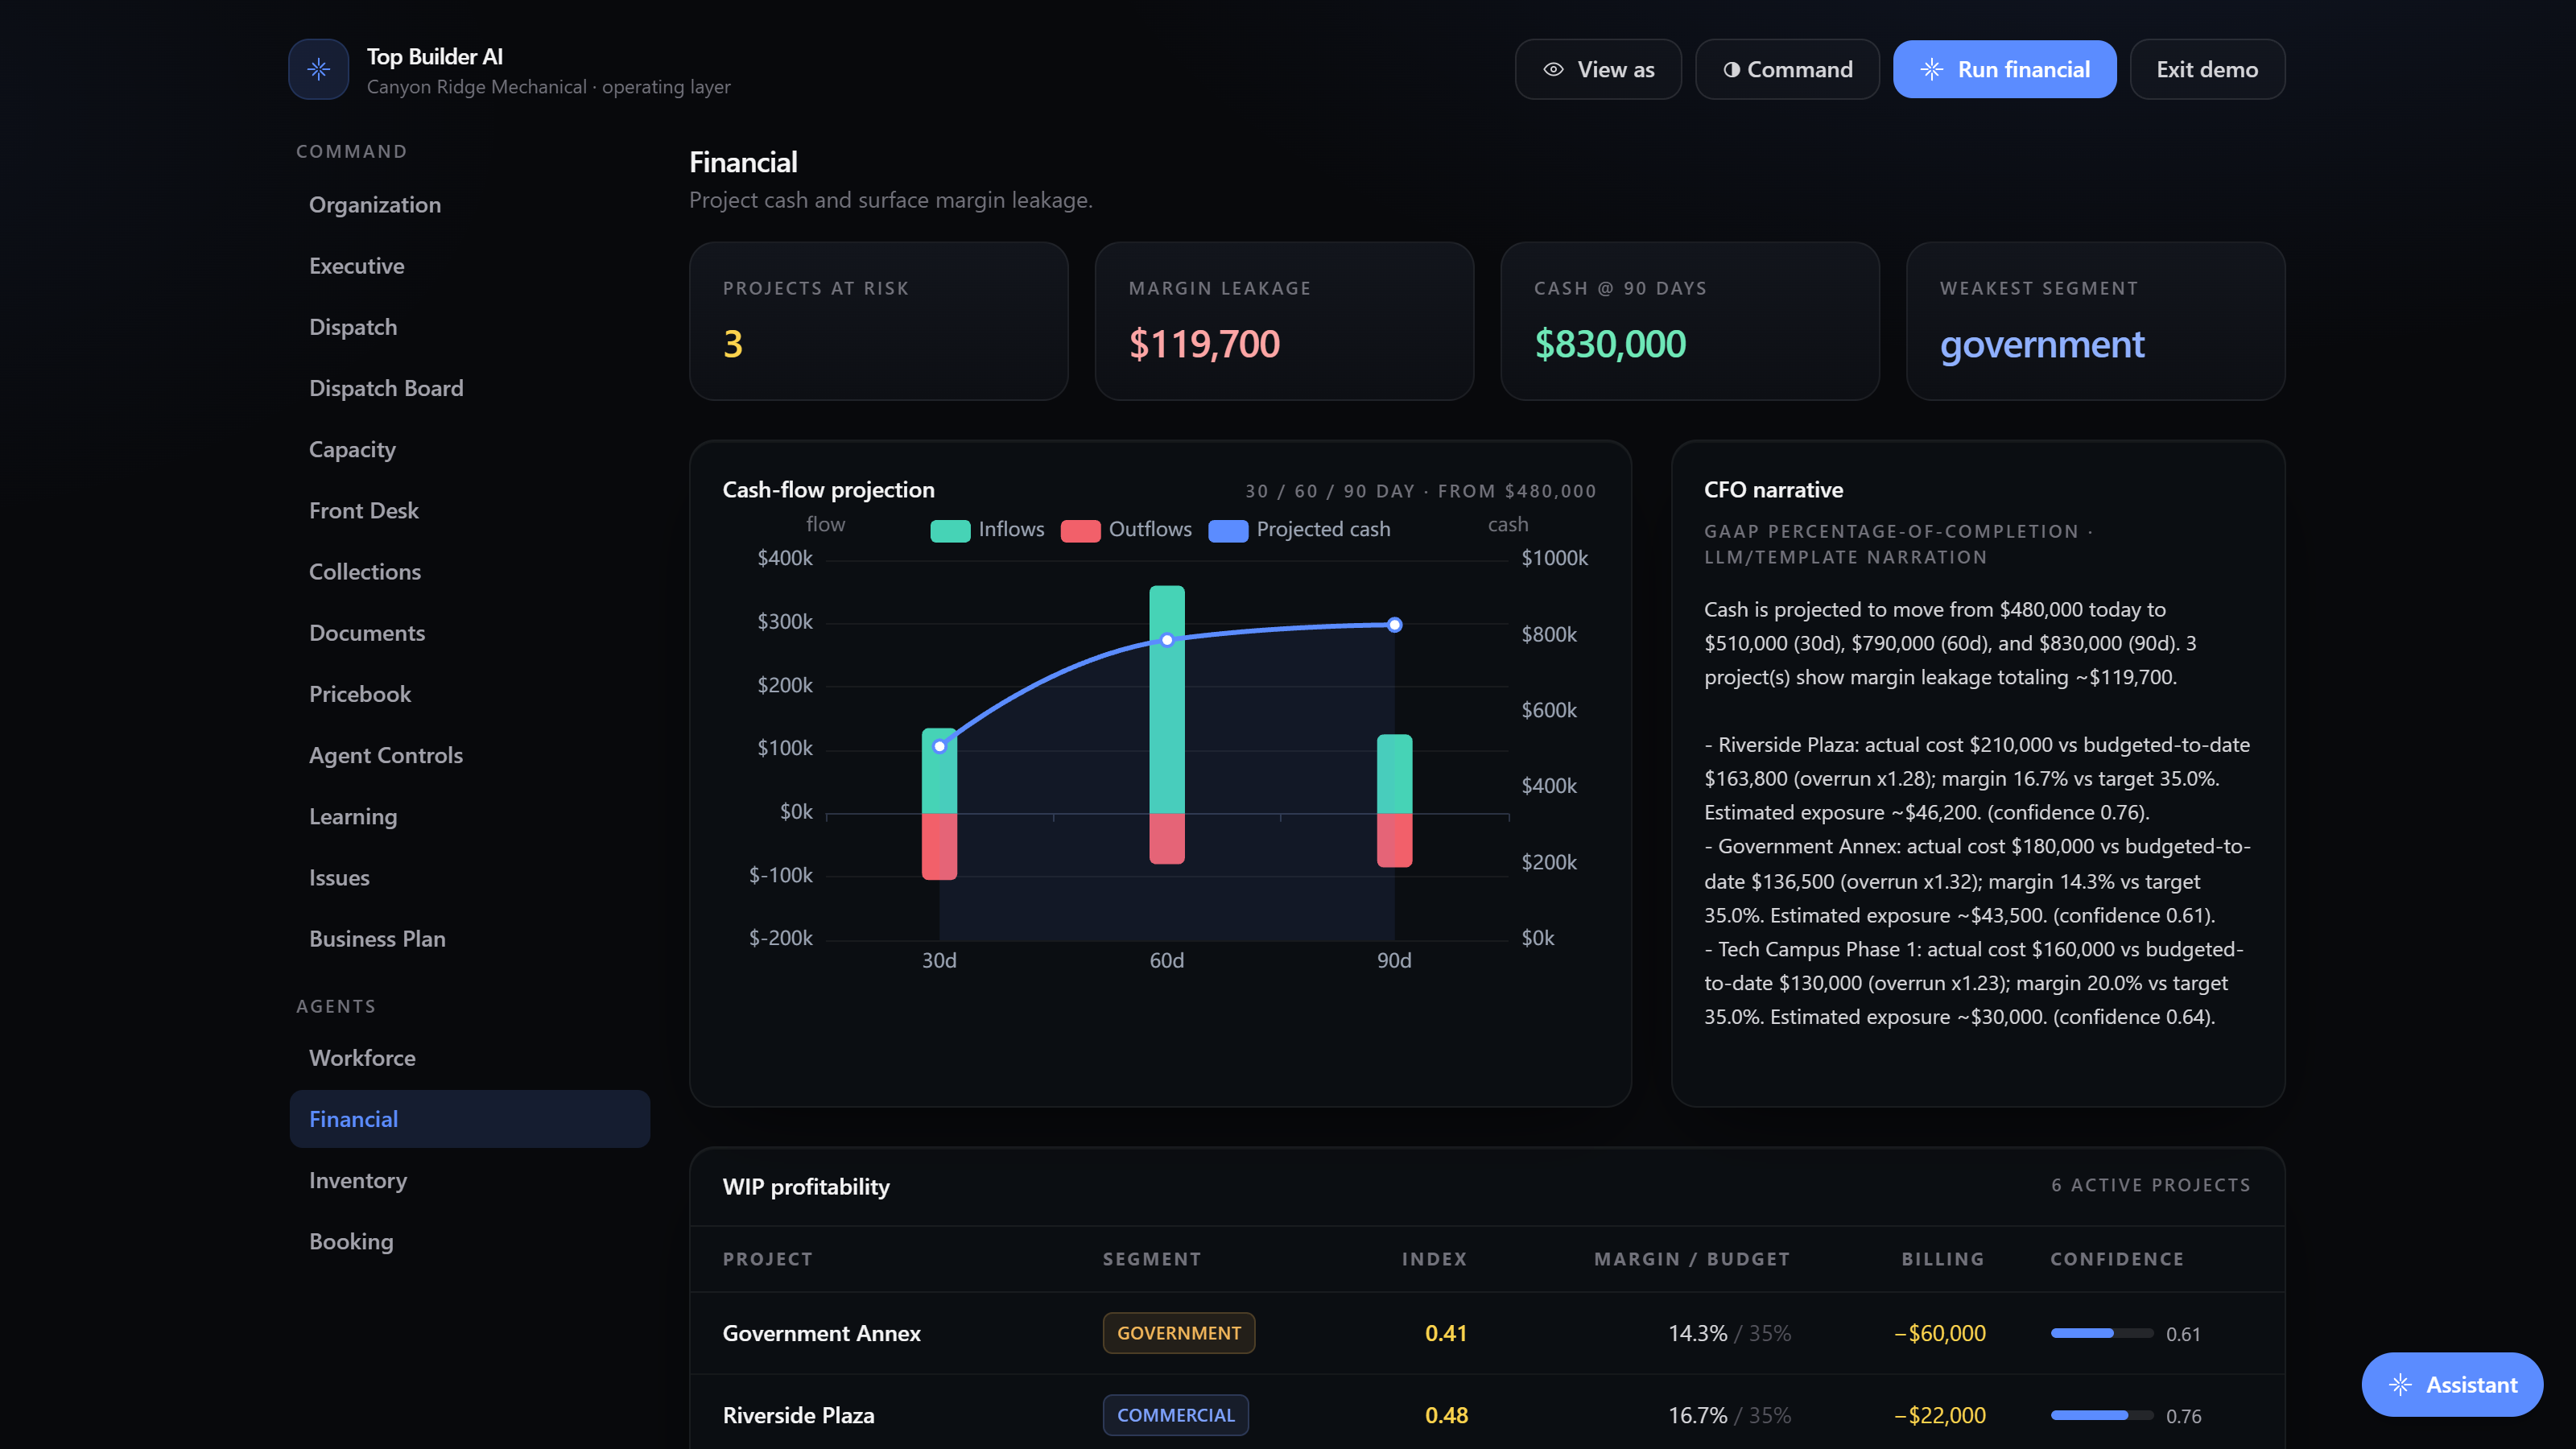
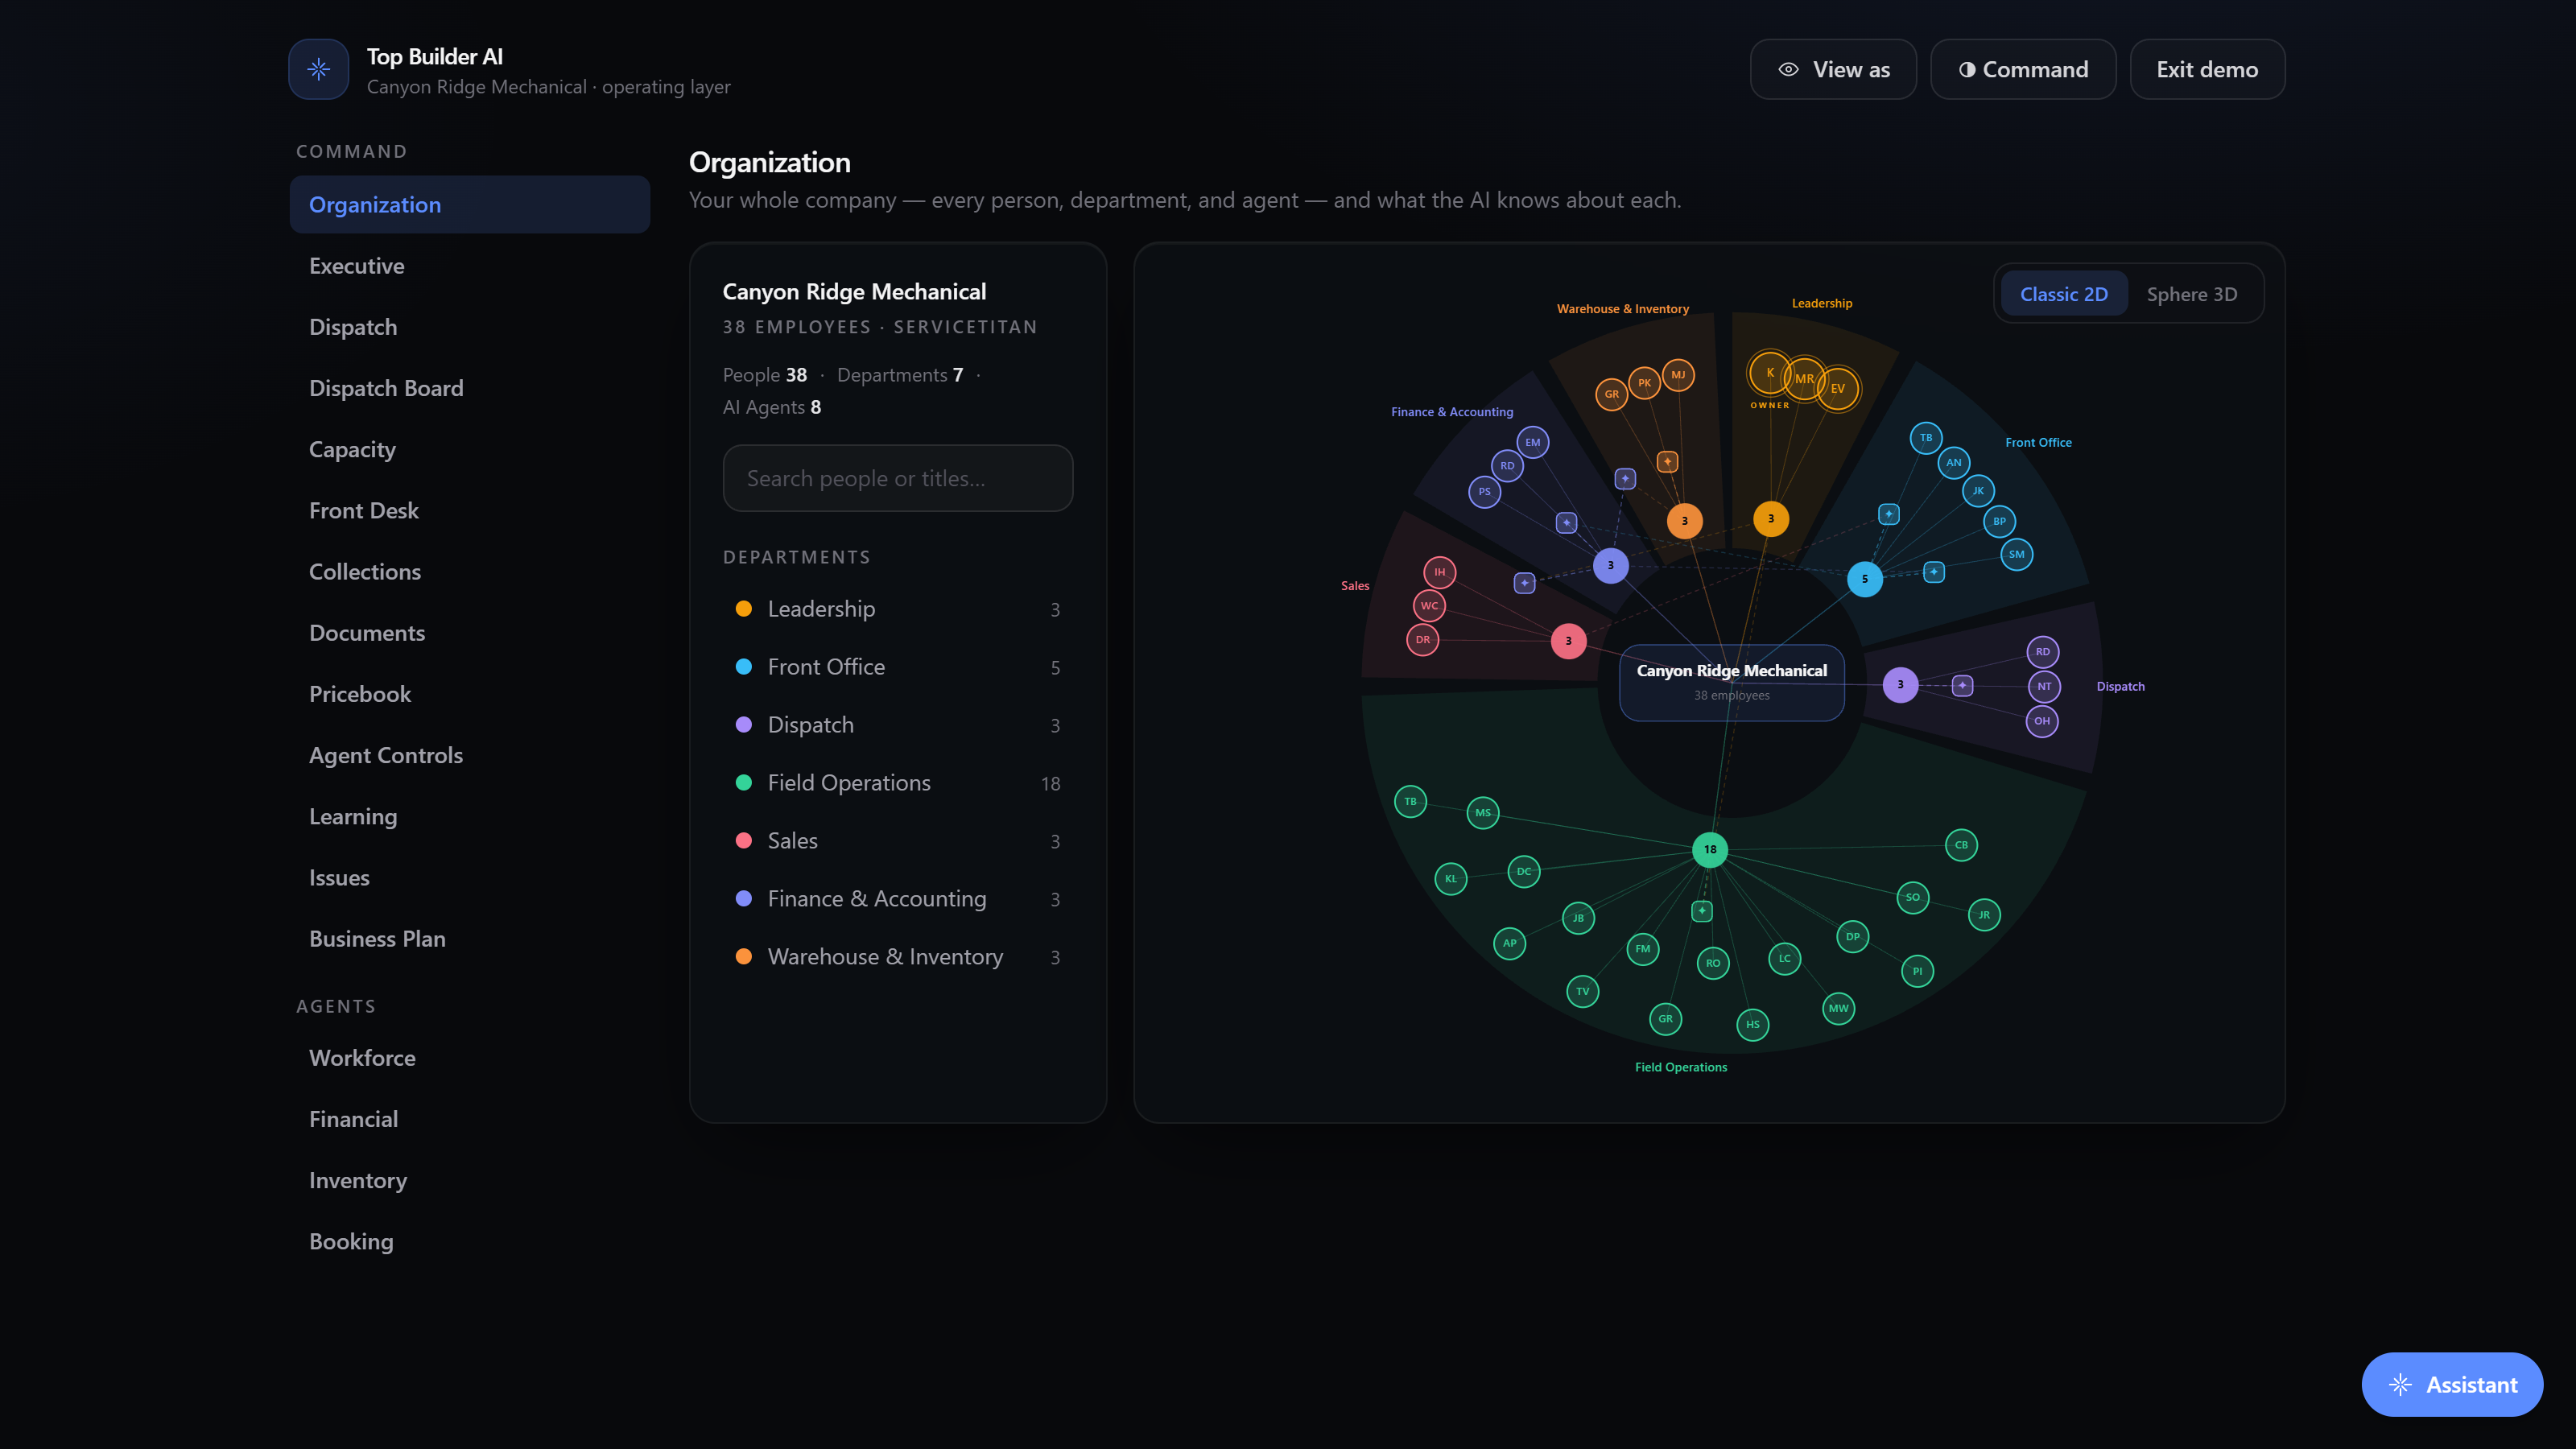
Top Builder AI installed on top of the systems the shop already ran. It did not replace ServiceTitan or QuickBooks. It sat between them as an integration bridge: field data flows out of ServiceTitan, Top Builder AI categorizes it, costs it, and reconciles it, and the result lands as financial truth in QuickBooks. The Financial agent computed margin per job continuously instead of at month-end, with every figure coming from pure, tested code so it was exact and auditable. The Pricebook agent re-costed the flat-rate book against current material and labor cost and proposed corrected prices for the owner to approve or reject. The Inventory agent tied truck stock to job numbers, so material cost reduced the job that consumed it instead of disappearing into general shrinkage. Every agent ran advisory by default, set to Off, Approve-first, or Auto, with data isolated to this shop under row-level security. Founder Cory Salisbury ran the install hands-on.
Results, modeled
+3 to +4 pts
Net profit margin lift in year one, about 6% to roughly 9 to 10%
ACCA benchmarking puts the residential HVAC median near 5.8% net and the top quartile near 13.2%. Modeled as moving partway toward the achievable band, not to top-quartile, to stay conservative.
~$210K to ~$280K
Annual profit recovered
A 3 to 4 point net margin gain applied to about $7M revenue, where each point is roughly $70K. Recovery, not new sales: pricing work to its true cost and attributing material cost to the consuming job.
15 to 30%
Margin lift from re-costing the flat-rate book, modeled at the conservative end
Multiple 2026 pricing studies report 15 to 30% first-year margin improvement from structured pricing guides. Modeled at the low end given a shop already at median.
12 to 18%
Stale-pricebook material drift the agent corrects for
Published 2026 HVAC cost data on copper, aluminum, steel, and components, plus 5 to 10% parts increases per year. This is the gap a once-a-year repricing cadence leaves uncovered.
Under 10%
Inventory shrinkage target; parts cost recovered into per-job margin
ACCA HVAC guidance cites shops targeting 10% or less shrinkage. Attributing parts to job numbers moves that cost onto the consuming job, correcting an install's real versus on-paper gross.
Same day
Time from job completion to known margin, versus weeks at month-end
Deterministic per-job costing runs continuously off the ServiceTitan-to-QuickBooks bridge instead of a manual month-end reconciliation. Modeled, reflecting the design rather than a measured client cycle time.
The kind of thing an owner tells us: we were busy all year and still wondered where the money went. Turns out a handful of jobs lost money every month and we never knew until the books closed, by then it was too late to do anything about it. Now I see the margin on a job the day we finish it, and the price book actually reflects what parts cost today.
Timeframe: modeled over a representative first-year engagement, with per-job margin visibility from the first reconciliation cycle.
Illustrative benchmark scenario, not a real named customer. Top Builder AI is pre-launch, so no live client results exist yet. Every figure above is modeled from published 2026 HVAC industry benchmarks (ACCA Financial Benchmarking Study and 2026 margin and pricing studies from Steph's Books, FieldCamp, ServiceTitan, BuildOps, and others) applied to a representative 14-tech, around $7M shop. The numbers describe what the math supports for a contractor at this profile, not a measured outcome from a specific company.